
Your databases should never surprise you.
Proactive monitoring and full estate visibility help operations teams catch issues before users do, resolve incidents faster, and keep the entire database environment performing at its best — powered by Redgate Monitor, deployed and managed by Acuative.
Stop reacting. Start preventing.
Acuative deploys and manages Redgate Monitor across your SQL Server, PostgreSQL, Oracle, MySQL, and MongoDB environments — on-premises, in the cloud, or hybrid. Your teams get a single, unified view of every server in your estate, intelligent alerting before problems escalate, and the diagnostic depth to fix issues in minutes rather than hours. No more reactive firefighting.
- Stop reacting, start preventing — custom alerting thresholds and proactive health checks flag issues before they become incidents. Catch a slow query trend on Tuesday, not a production outage on Friday.
- Resolve in minutes, not hours — historical metrics, wait statistics, query performance data, and built-in diagnostics pinpoint root causes immediately.
- Scale your estate, not your team — whether monitoring five databases or five hundred, your lean DBA team stays in control without being overwhelmed.
- Protect with confidence — access controls and audit features keep sensitive databases protected, access managed by role, and every change recorded.

Live visibility into every server
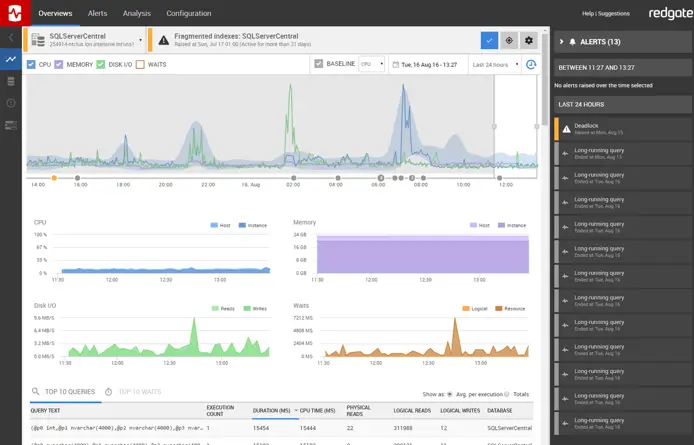
Keep track of the health and performance of every database server in your estate — with live visibility into what's happening right now.
- CPU, memory, disk I/O, and network utilisation across all servers
- Top queries ranked by CPU, reads, writes, and duration
- Wait statistics analysis to identify performance bottlenecks
- Blocking chains and deadlock capture with full query text

Only the alerts that matter
Generic default thresholds create noise. Custom thresholds aligned to your actual performance baselines ensure your team is alerted only to issues that truly matter.
- 30+ built-in alert types across performance, availability, and security
- Priority-based severity with separate routing
- Alert suppression windows for planned maintenance
- Delivery via email or webhook to Slack, Teams, PagerDuty, ServiceNow
One pane across every environment
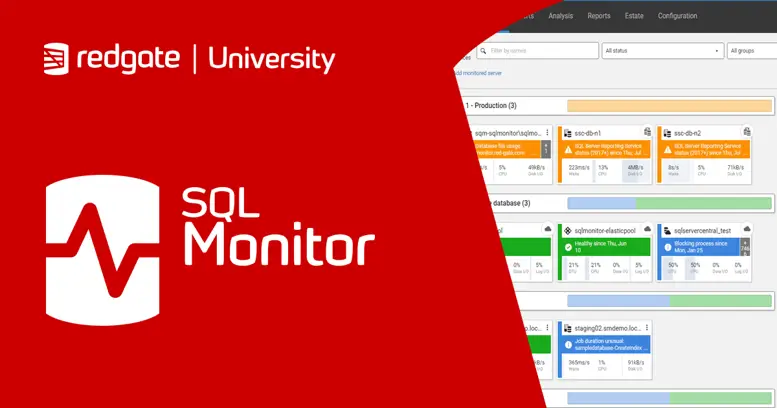
A single browser-based dashboard gives your entire team visibility across every server, regardless of where it's hosted — tailored to your operational structure.
- Unified view across on-premises, cloud, and hybrid environments
- Server inventory: version, edition, patch level, and disk usage
- Availability Group and cluster topology monitoring
- Role-based access so each team sees only what they need

Plan ahead, not just react
Reactive monitoring only tells you what's broken right now. Historical performance data helps teams identify trends, plan capacity, and understand whether changes helped or hurt.
- Performance history from 2 hours to 12 months in one view
- Trend analysis across size, query load, and resource consumption
- Before-and-after comparison across releases and patches
- Capacity planning data before limits are hit
Deployed & tuned for your estate.
Estate Discovery
We map every server, version, hosting location, and current tool, then design the right architecture.
Deployment
We deploy the platform and lightweight agents, configuring groupings, intervals, retention, and dashboards.
Alert Setup
We set performance baselines per group and configure custom alert rules routed to your ITSM.
Team Enablement
We train your DBA and ops teams on the dashboard, alert investigation, and threshold tuning.
Managed Support
Ongoing management — adding servers, tuning alerts, upgrades, and regular trend reports.
Questions, answered.
Redgate Monitor covers SQL Server (on-premises and Azure SQL), PostgreSQL, Oracle, MySQL, and MongoDB. Acuative manages the configuration across all platforms your estate uses — including hybrid environments that mix on-premises and cloud-hosted databases.
No. Acuative works with your team to establish performance baselines specific to your environment and configures custom thresholds accordingly. Generic defaults create noise; we configure alerts that mean something to your team.
Yes — this is exactly what Redgate Monitor is designed for. Centralised visibility, proactive alerting, and built-in diagnostics mean lean teams can manage large, geographically distributed estates without adding headcount.
Acuative configures role-based access, audit logging of configuration changes, and database access monitoring — supporting compliance requirements and giving your security and audit teams the visibility they need.
Yes. Redgate Monitor supports webhook-based alert delivery, which Acuative configures to route alerts to Slack, Microsoft Teams, PagerDuty, ServiceNow, or any HTTP-based endpoint your team already uses.

