
See everything. Fix what matters.
Acuative's Full Stack Observability service unifies network, application, and user-experience telemetry into a single view — so your team spends time solving problems, not assembling dashboards from a dozen tools.
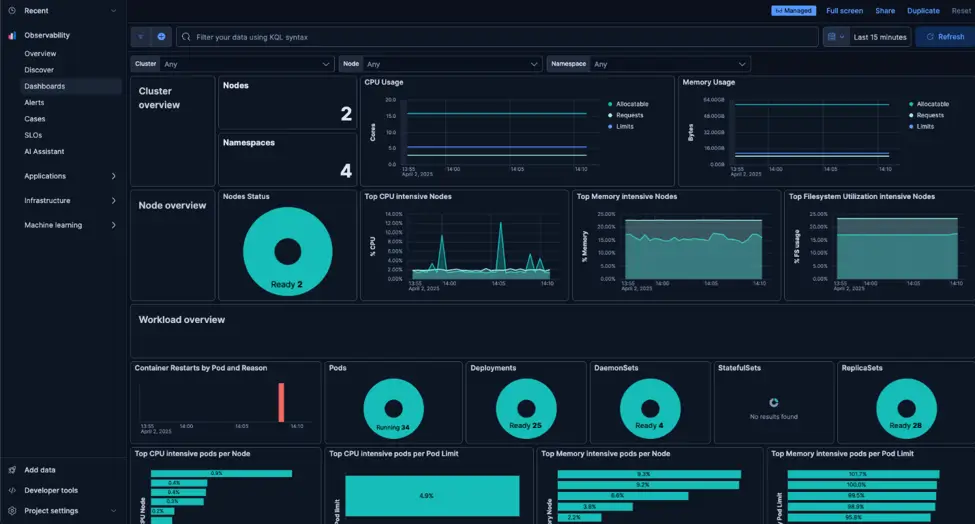

From data overload to clear decisions.
Most enterprises have observability — they just have it across a dozen disconnected tools, with nobody watching at 2 AM. Acuative gives you one unified view, tuned to the applications that matter, and a 24/7 NOC that engages before you do.
Every layer of the stack, watched together.
Network, application, and user-experience telemetry stop being separate concerns when one team can correlate them in real time. We instrument every layer and present it as a single story.

Real-time network telemetry
SNMP, NetFlow, and streaming telemetry across every device, link, and tunnel — with contextual alerting that tells engineers where to look first.
SNMP · NetFlow · gNMI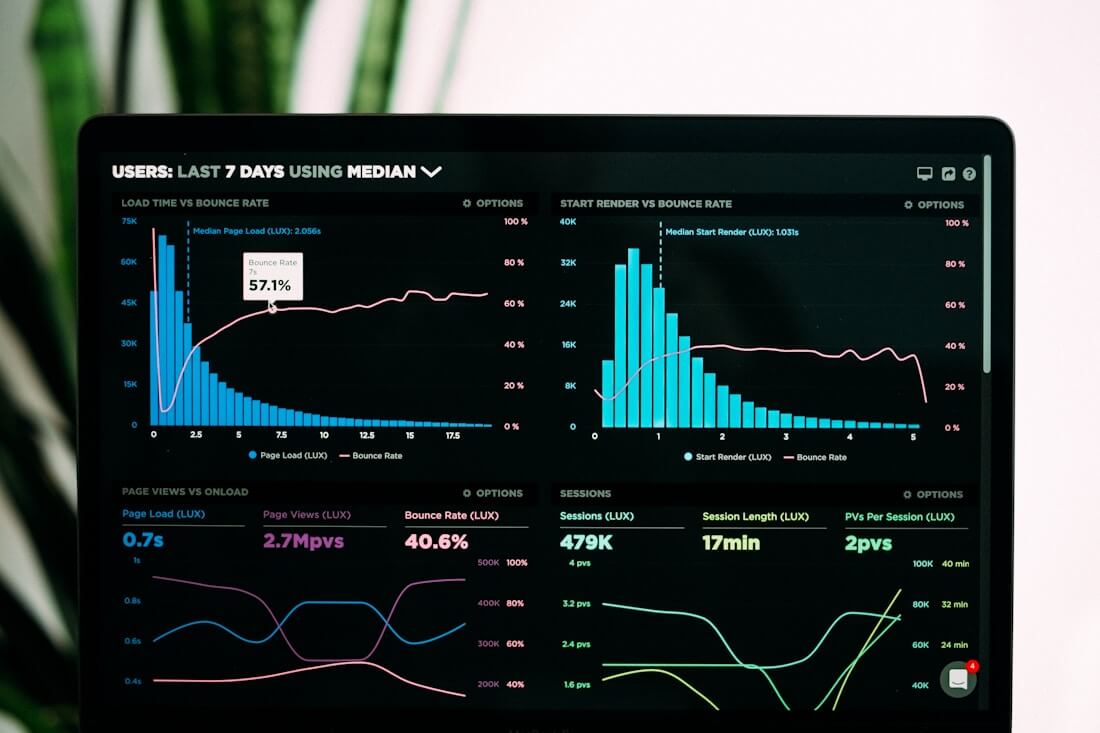
APM & distributed tracing
Latency, errors, and traces across services. We correlate app health back to the network path beneath it.
APM · traces
Real-user & synthetic monitoring
Synthetic probes for SaaS and voice paths plus real-user measurements at the branch and on devices.
RUM · synthetic
Centralized log correlation
Logs from every system stream into one searchable index, correlated to alerts so engineers stop pivoting between tabs.
Splunk · ELK
Executive-ready posture
SLA tracking, capacity trends, and exception reports tuned for the audiences that need them — engineering, ops, and the C-suite.
Weekly · quarterlyVisibility tuned to your applications.
Telemetry is only useful when it's interpreted in context. We tune dashboards and alerts to the applications that matter most in your industry.
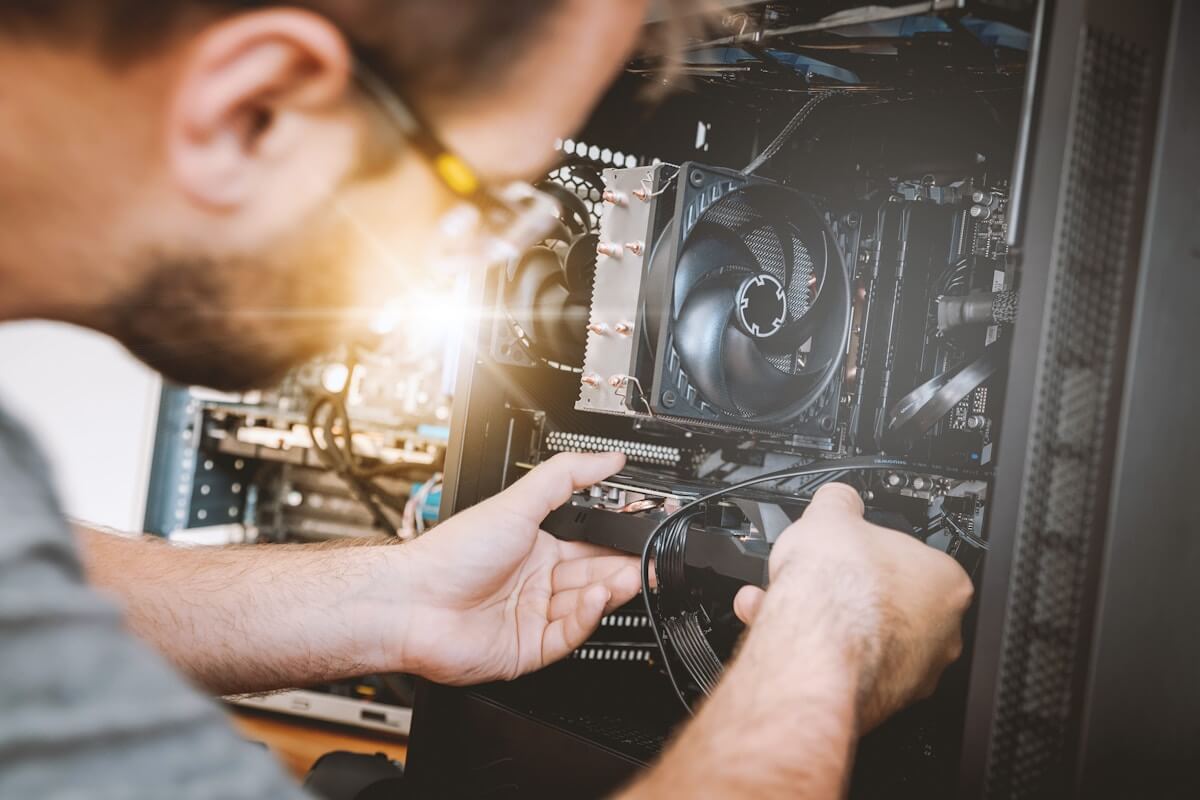
Retail
Per-store dashboards that surface POS health, payment latency, and customer Wi-Fi quality at every location.
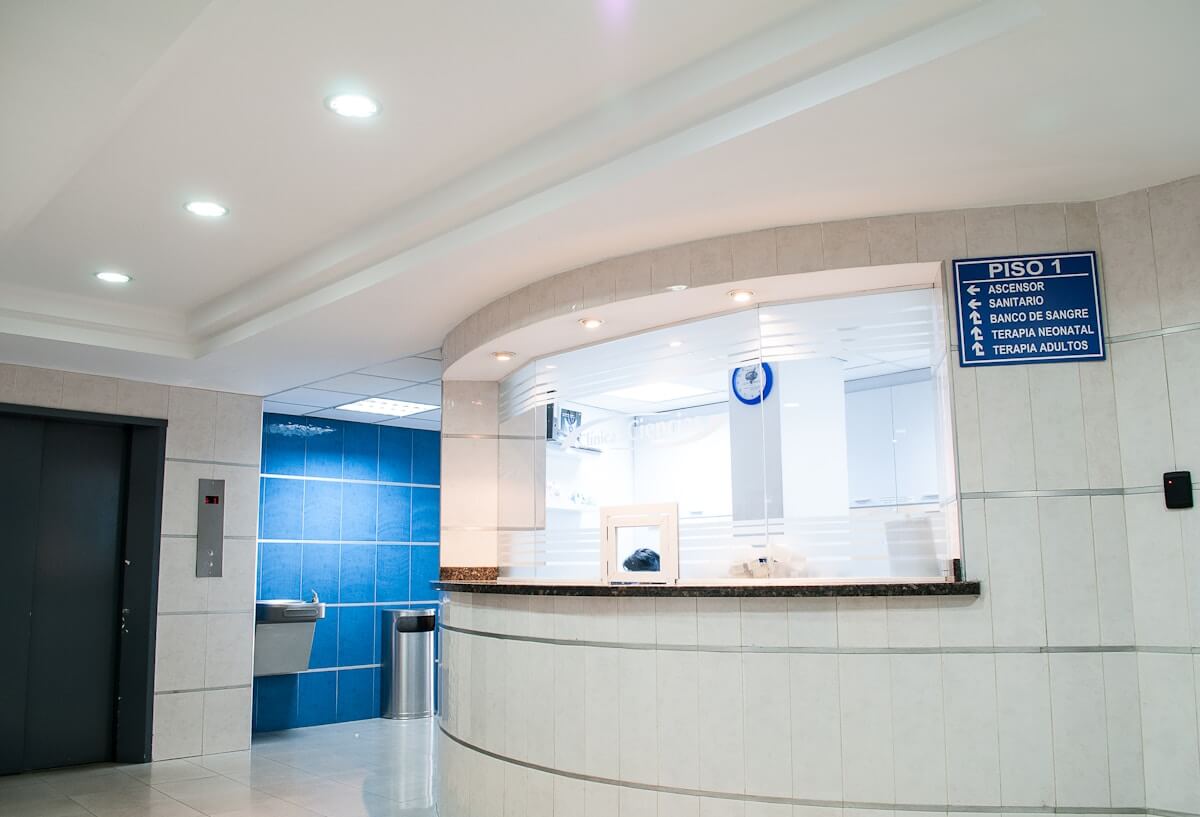
Healthcare
EHR access times, medical-device connectivity, and telemedicine call quality tracked against clinical SLAs.

Financial services
Branch-to-branch latency, ATM uptime, and digital-channel responsiveness with audit-ready evidence.

Defense & government
Mission-system uptime, secure-comms health, and continuous compliance evidence for regulated environments.
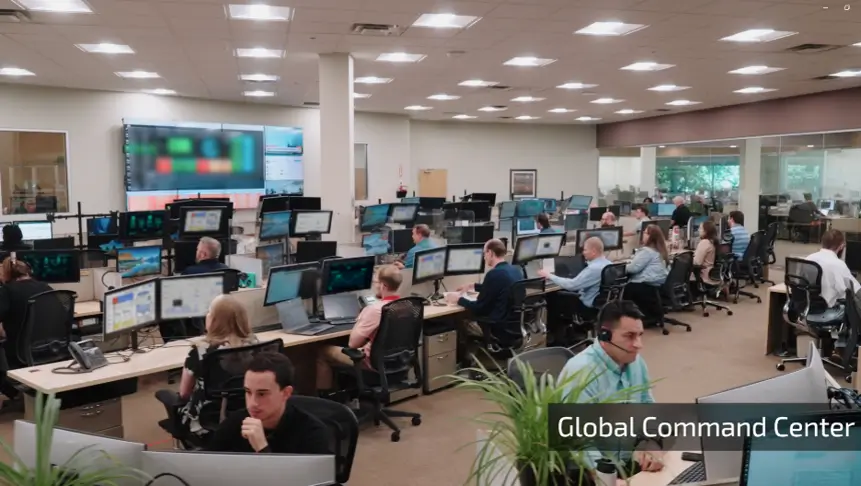
Dashboards are only as good as who watches them.
Acuative's Global Command Center monitors your telemetry continuously — and when something deviates, an engineer engages before your team is even paged. We don't just deliver dashboards; we deliver responses.
We integrate with what you already run.
We bring our own monitoring stack when you need it, and integrate cleanly with the platforms you've already invested in.
VP of IT OperationsMulti-site healthcare network“We had monitoring data all over the place, and it was tough to get a clear picture of what was actually going on. Acuative brought it together in one view, and now we can catch EHR latency issues before clinicians start noticing them. It’s made things a lot easier for our team.”
Questions, answered.
No. We integrate with your existing observability platforms and add the operations layer on top. Most engagements start by unifying the dashboards you already have, not replacing them.
Initial network and infrastructure telemetry typically goes live in 2–3 weeks. Application and user-experience instrumentation depends on your app architecture but usually takes 4–6 weeks to baseline.
Respond. Our NOC engages on every alert with documented runbooks — your team gets an engineer on the phone, not just an email.
Yes. We deliver weekly, monthly, and quarterly reports tailored to engineering, operations, and leadership audiences — with the underlying data available on request.
Managed Network Services covers the network itself; Full Stack Observability covers visibility across network, applications, and user experience — often in environments we don't manage. The two are complementary and frequently bundled.
 Blog
Blog The Cost of Downtime vs. The Cost of Observability
Which is Higher? It's the question every budget owner eventually asks out loud: "Is this observability platform actually worth what we pay for it?" The honest answer only become...
Read article → Blog
Blog What Is Acuative Managed Services?
A Guide for IT Leaders Your Organization generates more data than ever - from applications, infrastructure, security events, and user activity. The question is no longer whether...
Read article → Blog
Blog Seeing Clearly in a Complex World.
Wesam AlGhazawi How Observability Supports the Financial Sector The Complexities in Modern Financial Landscape The financial services industry is undergoing rapid digital transf...
Read article → Case Study
 Transforming Digital Infrastructure with Full Stack Observability
The Client: SPL The Challenge: SPL (formerly Saudi Post) runs nationwide logistics and postal services for individuals, businesses, and government. With growing digital complexi...
Read case study → Blog
Blog Observability for DevOps: Why It’s More Than Just Monitoring
Wesam AlGhazawi Observability for DevOps: Why It’s More Than Just Monitoring The DevOps Challenge In modern software delivery, speed is everything. New features roll out quickly...
Read article → Blog
Blog What Is Observability and Why It Matters More Than Ever in 2025
Emran Abdullah Why Seeing More Means Doing More in Today’s Digital Era In today’s fast-moving tech world, knowing what’s going on inside your systems isn’t optional, it’s essent...
Read article →